---
title: "Document Title"
author: "Your Name"
date: "2026-01-15"
format: html
---HW 01
Lectures 01-03
Due: Tuesday, Jan 27 at 11:59pm
Starting a new Quarto file
For this assignment (and all future assignments) you will begin a new Quarto file. To do this, open RStudio and make sure you are inside your course project folder with File > Open Project > …. To create a new Quarto file, go to the top menu and click File > New File > Quarto Document. A pop-up will appear asking for a title, author, and format. You may leave these as the default options for now. Click OK and a new file will open.
In the document, Quarto automatically adds some starter text and code chunks. You may delete everything below the YAML header (everything under the second set of ---). You should be left with just a YAML section at the very top, which looks something like this:
Now, Edit the YAML header. Change
title -> the assignment name (e.g.
HW 1)author -> your name
date -> today’s date
Now, save your file. Go to File > Save as, and name it something clear like hw1.qmd. Keep it in your project folder. You’re ready to begin!
Dementia and eating behaviors
Use the following study to answer Exercises 1-4.
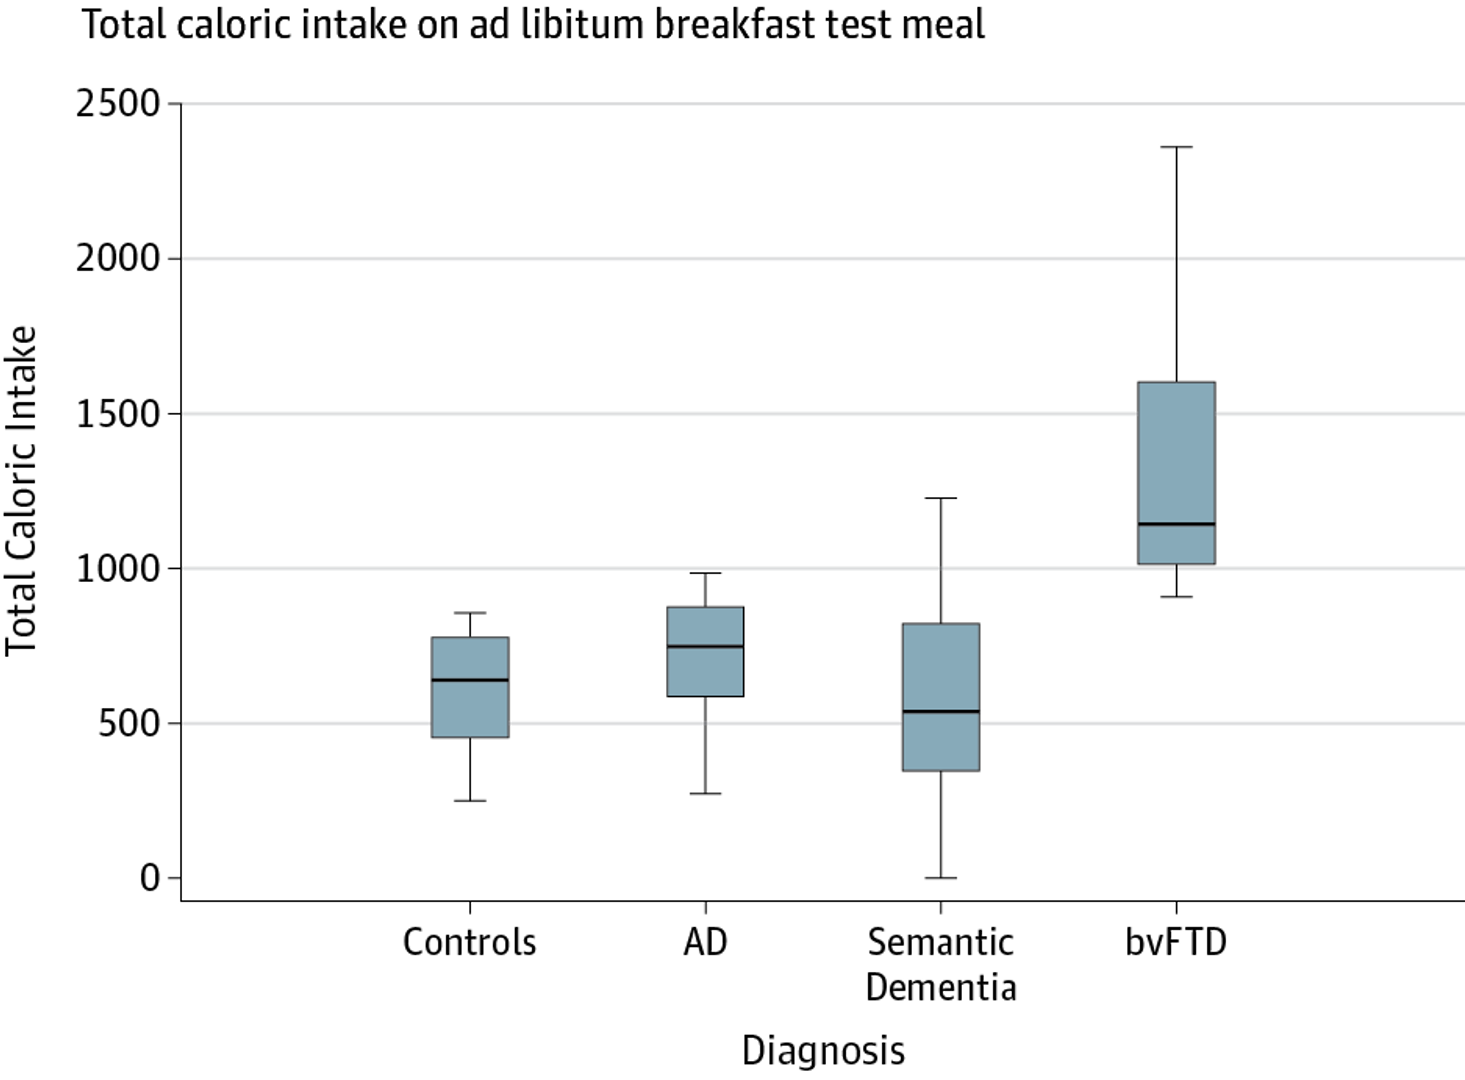
Ahmed et al. (JAMA Neurology, 2016) conducted a study examining disturbances in eating behaviors among patients with dementia. Patients without dementia, with Alzheimer disease (AD), with semantic dementia, and with behavioral-variant frontal temporal dementia (bvFTD) were offered a breakfast buffet and left alone for 30 minutes to eat. After completion, the total caloric intake of each patient was measured. Boxplots summarizing the distributions of calories consumed across the patient types are displayed below.
Exercise 1
Was this an observational study or an experimental study? Explain.
Do you expect the distribution of caloric intake among bvFTD patients to be left-skewed, right-skewed, or symmetric? Why?
Describe what it means for this specific study to be reproducible and replicable.
Exercise 2
What type of data are the following variables in the study? Be specific, e.g., “categorical ordinal” or “numeric discrete”, etc.
- Type of dementia (AD/SD/bvFTD/None)
- Total caloric intake
- % of calories from sugar
- Disease duration
- Frontal Rating Scale (mild/moderate/severe)
Exercise 3
Describe an appropriate visualization that summarizes the % of calories from sugar at the breakfast buffet, by the Frontal Rating Scale of the study participants.
Describe an appropriate visualization that summarizes the three-way relationship between total caloric intake at the breakfast buffet, disease duration in years, and type of dementia among these study participants.
Exercise 4
The authors state that they uncovered “elevated total caloric intake…in patients with bvFTD, supporting its diagnostic value for this disease….” Is this is a reasonable statement to make from the data visualization? Explain why or why not.
Suppose the authors wanted to “tell a story” with the title to their visualization. Suggest a more effective title than the one presented.
Covid-19 vaccine dataset
Use the following paper/table to answer Exercise 5.
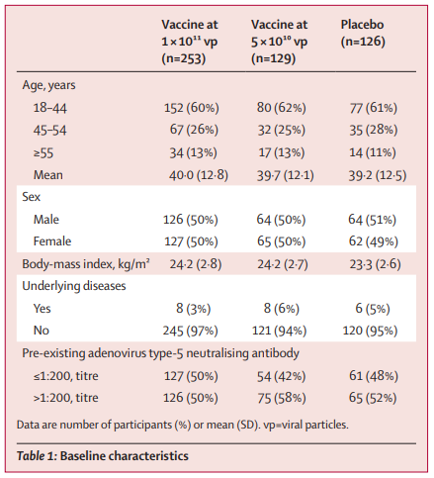
Zhu et al. (The Lancet, 2020) conducted the first randomized trial of a recombinant adenovirus COVID-19 vaccine in healthy adults, with the aim of determining an appropriate dose for a larger efficacy study. They had three treatment arms: placebo, low dose (5 × 10¹⁰ virus particles), and high dose (1 × 10¹¹ virus particles). The following table depicts the baseline characteristics of their study population:
Exercise 5
Calculate the following probabilities. It’s ok to express answers as unsimplified fractions). If the probabilities cannot be determined, please state so and what additional information is needed to calculate the quantity of interest. Provide a 1 sentence explanation about how you calculated each value based on the table.
What is the probability that a randomly selected patient in the trial …
… was assigned to placebo?
… was assigned to placebo or was male?
… was assigned to placebo and was male?
… was not assigned to high dose vaccine and had no underlying diseases?
… was female or had underlying diseases?
… was female or was not assigned to either vaccine dose?
… was aged 18 - 44, given that they were assigned to high dose vaccine?
… was not assigned placebo, given that they were aged 45-54?
Socioeconomic factors and visual impairment
Use the following paper and figure to answer Exercises 6 and 7.
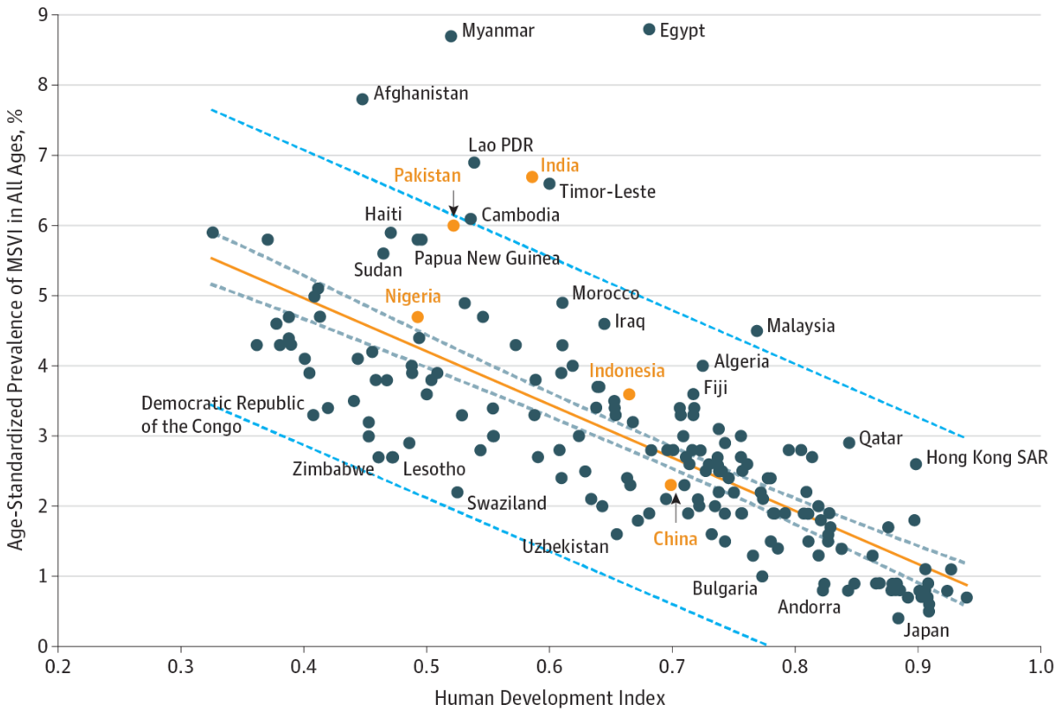
Wang et al. (JAMA Opthamology, 2017) examined the association of socioeconomic factors with prevalence of visual impairment and blindness. The following scatterplot depicts the relationship between Human Development Index (HDI) and the age-standardized prevalence of moderate to severe visual impairment (MSVI). The countries highlighted in orange are the 5 countries with the largest number of blind people.
Exercise 6
In general, are higher or lower HDIs associated with higher prevalence of MSVI?
Among China, India, Pakistan, Nigeria, and Indonesia, which has the lowest HDI?
Exercise 7
Does India have higher or lower prevalence of MSVI than might be expected given its HDI?
In their conclusion, the authors state “Burden of visual impairment and socioeconomic indicators were closely associated and may help to identify countries requiring greater attention to these issues.” Do you think this is a reasonable statement to make from the scatterplot? Why or why not?
Submission
As you’ve seen previously, we can Render into an .html file that can be opened by any web browser. To export it as a .pdf, open the file in your web browser and then print to or save as a .pdf document. Contact your TAs in Ed Discussion if you need help!
You will submit the PDF documents for labs and homework to Gradescope as part of your final submission.
To submit your assignment:
Access Gradescope through the menu on the BIOS 600 Canvas site.
Click on the assignment, and you’ll be prompted to submit it.
Mark the pages associated with each exercise. All of the pages of your lab should be associated with at least one question (i.e., should be “checked”).
Select the first page of your .PDF submission to be associated with the “Formatting” section.
Grading
Ex 1: 3 pts
Ex 2: 3 pts
Ex 3: 2 pts
Ex 4: 2 pts
Ex 5: 4 pts
Ex 6: 2 pts
Formatting: 3 pts
The “Formatting” grade is to assess the document format. This includes having a neatly organized document (no excessive output, warnings/messages when loading packages and/or data) with readable code and your name and the date updated in the YAML.